Navigating Climate Change: A Guide to Understanding and Mitigating Food Insecurity in an Overheating World
Overview
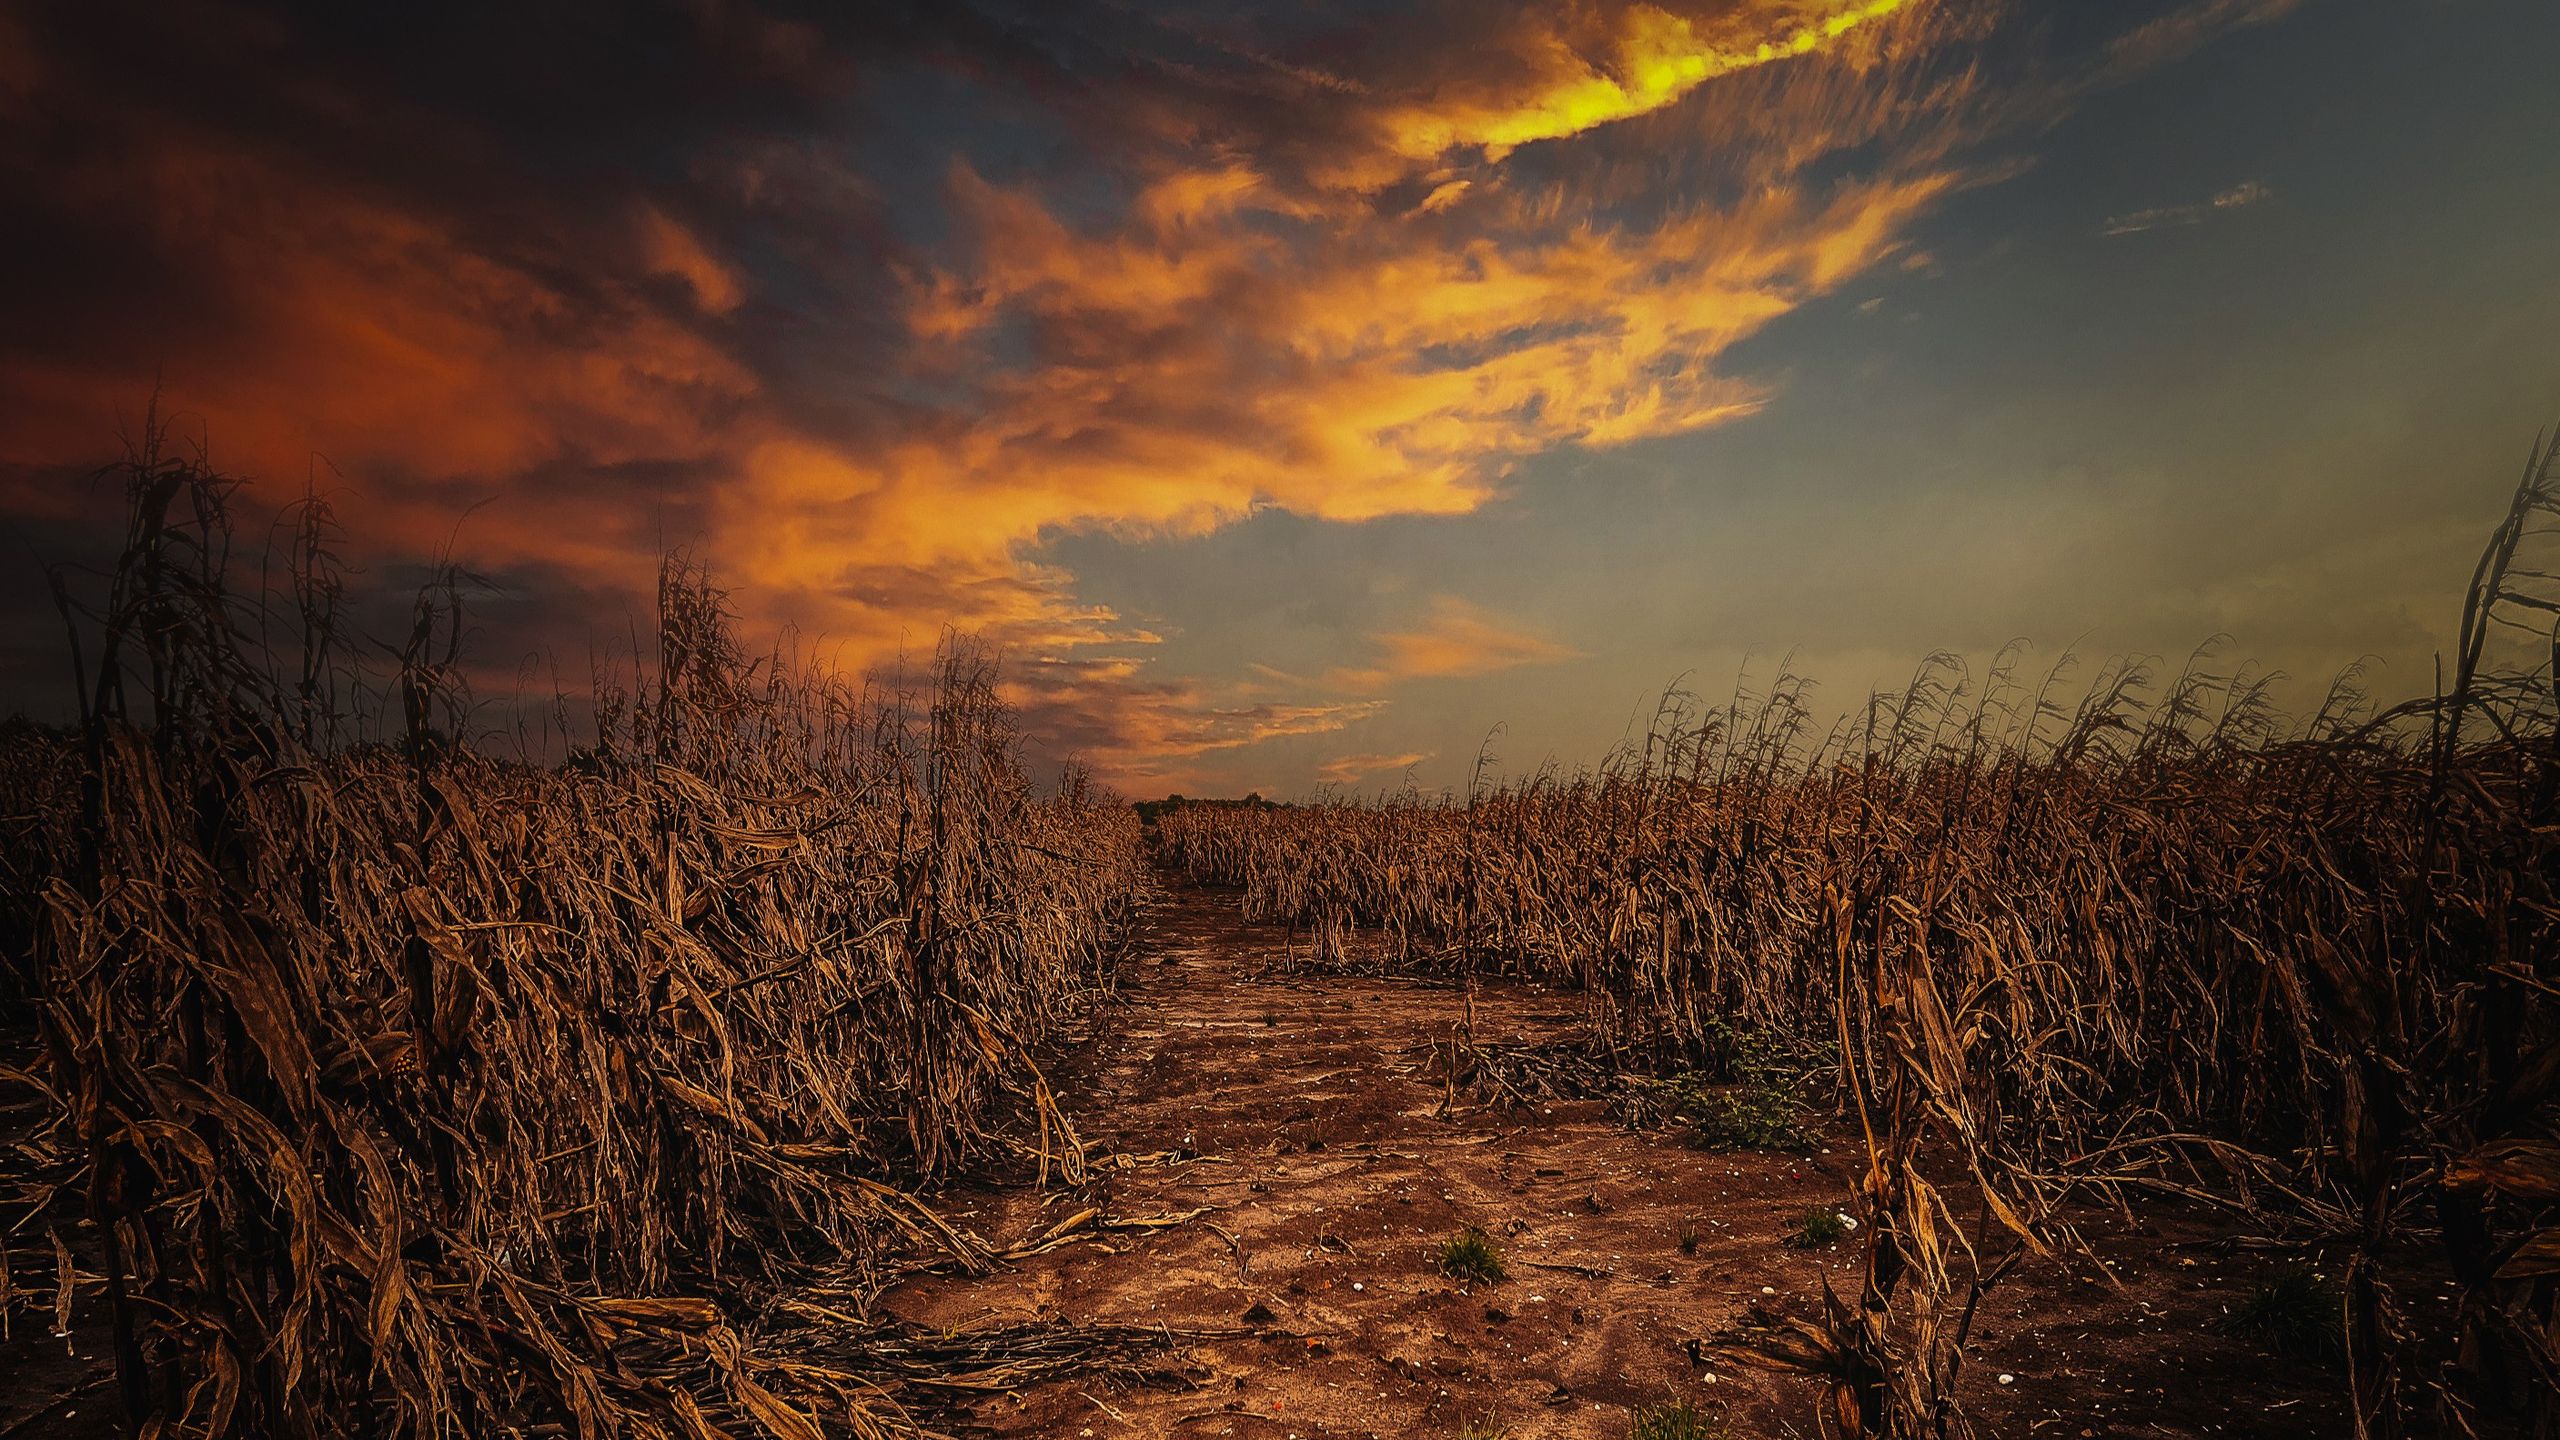
Climate change is no longer a distant threat—it is actively reshaping agricultural systems across the globe. As a United Nations report highlights, extreme temperature swings are disrupting crop cycles and endangering the livelihoods of agricultural workers. This guide draws on insights from environmental economist Shouro Dasgupta to explain how rising temperatures and erratic weather patterns are pushing food systems to the brink, and what steps can be taken to understand and mitigate the crisis. Whether you are a student, researcher, policy maker, or concerned citizen, this tutorial provides a structured approach to grasping the complex interplay between climate and food security.

The problem is clear: food insecurity is no longer confined to low-income countries. High-income nations are also feeling the strain as heatwaves, droughts, and floods become more frequent. This guide will walk you through key concepts, data analysis methods, and practical strategies to address the issue.
Prerequisites
Before diving into the steps below, ensure you have a foundational understanding of the following:
- Basic climate science: Familiarity with terms like greenhouse gases, global warming, and extreme weather events.
- Introductory economics: Understanding of supply and demand, market failures, and externalities.
- Data analysis skills (optional but helpful): Ability to interpret graphs and simple statistical outputs (e.g., from Python or R). No coding experience? Focus on the conceptual steps—each includes plain-language explanations.
- Access to reports (recommended): The latest IPCC or UN FAO reports on climate and agriculture.
Step-by-Step Instructions
Step 1: Recognize the Link Between Heat Extremes and Crop Failure
Climate models consistently show that every additional degree of global warming increases the likelihood of extreme heat events—days where temperatures exceed historical norms by 5–10°C. For crops, these spikes can be devastating. For example, wheat and maize have optimal growth ranges; temperatures above 30°C during pollination can reduce yields by up to 10% per degree.
Action item: Review historical temperature and crop yield data for your region. A simple analysis in Python would look like this:
import pandas as pd
import matplotlib.pyplot as plt

data = pd.read_csv('temperature_yields.csv')
plt.scatter(data['max_temp'], data['yield'])
plt.xlabel('Maximum Temperature (°C)')
plt.ylabel('Yield (tons/hectare)')
plt.title('Crop Yield vs. Temperature')
plt.show()
If yield shows a clear downward trend beyond a certain temperature threshold, you're witnessing the direct impact of heat extremes. Check UN reports for global patterns too.
Step 2: Analyze the Economic Impact on Agricultural Systems
Environmental economist Shouro Dasgupta emphasizes that climate change creates both short-term shocks and long-term structural shifts. In the short term, a single heatwave can destroy a harvest, causing price spikes. Over decades, shifting growing seasons force farmers to abandon traditional crops or regions.
Economic model example: Use a simple supply-demand framework. When yields drop, supply shifts left, raising prices. If demand is inelastic (people need food), price increases are large, hurting consumers—especially the poor. Run a scenario:
- Assume a 20% yield reduction for a staple crop.
- Supply elasticity = 0.3, demand elasticity = -0.2.
- Calculate new equilibrium price: price rises by ~33%.
To build intuition, plot the shifts using basic algebra or loop through elasticity values.
Step 3: Identify Vulnerable Populations and Regions
Food insecurity is not uniform. Low-income countries often have less adaptive capacity, but even wealthy nations see vulnerable groups—farmers dependent on single crops, or low-income urban households. Dasgupta notes that extreme temperature swings hurt agricultural workers directly through heat stress and reduced productivity.
Data-driven approach: Overlay climate vulnerability maps with socioeconomic data. Tools like NASA's POWER database provide temperature projections; combine with World Bank poverty indices. Look for regions with high poverty and high projected warming. Example: Sub-Saharan Africa and South Asia are hotspots.
Key indicator: The number of people exposed to extreme heat in agriculture—tracked by international organizations—is rising from hundreds of millions to over a billion by 2050.
Step 4: Evaluate Adaptation Strategies
Several strategies can buffer agricultural systems. They range from technological to policy-based:
- Crop diversification: Switching to heat-tolerant varieties (e.g., drought-resistant maize).
- Irrigation improvements: Drip irrigation reduces water waste.
- Climate-smart agriculture: Practices like agroforestry or no-till farming.
- Financial tools: Crop insurance and social safety nets for farmers.
Evaluate effectiveness: Cost-benefit analysis. For example, adopting heat-resistant seeds may cost $50/ha but increase yields by 20% during a heatwave. Compare to the cost of doing nothing (total loss). Use discounted cash flow to compute net present value.
Step 5: Implement Policy Interventions at Scale
Individual actions are insufficient; systemic changes are needed. Policy recommendations from environmental economics include:
- Carbon pricing to reduce emissions causing climate change.
- Subsidies for adaptation technologies.
- Investments in climate research and early warning systems.
- International aid for vulnerable nations.
Policy simulation: On a spreadsheet, model a simple carbon tax. Assume a $50/ton CO2 tax, causing a 2% global GDP loss but reducing temperature by 0.5°C by 2050. Estimate crop yield benefits—for instance, avoiding a 10% yield decline saves millions of tons of grain. Compare total benefit (avoided damages) versus cost.
Common Mistakes
- Ignoring non-linear effects: Many assume crop loss is proportional to temperature rise—but extreme events cause sudden collapse. Use non-linear models.
- Underestimating regional variation: A one-size-fits-all solution fails. Adaptation must be local.
- Neglecting interactions: Heat and drought often occur together, amplifying impact. Consider compound events.
- Assuming perfect adaptation: Adaptation has limits; even with strategies, some losses are unavoidable.
- Overlooking worker health: Heatstroke and reduced labor productivity directly affect harvests, not just crop biology.
Summary
Climate change is transforming food insecurity from a problem of poverty to a global systemic risk. This guide structured the understanding into five steps: recognizing the heat-crop link, analyzing economic impacts, identifying vulnerable populations, evaluating adaptation, and implementing policies. By combining data analysis with economic reasoning, we can better anticipate and mitigate the crisis. The key takeaway from economist Shouro Dasgupta is that food insecurity is no longer just about low-income countries—it affects everyone. Proactive measures at local and international levels are essential to safeguard agricultural systems in an overheating world.